
- TRUMP regained a bullish market structure on the 4-hour chart.
- The high spot demand and increased OI in the past 48 hours signaled buyers were coming back.
Official Trump [TRUMP] woke up from its ten-day slumber, where the price remained stuck to the $14.6-$17.9 region.
The trading volume had also been low, and it appeared that the previous downtrend would continue if Bitcoin [BTC] ran into more bad news.
Instead, Official Trump saw a quick price move higher on the 14th of February. This move has flipped the $17.88 level to support.
Is the memecoin ready to surge higher again and capture speculators’ imaginations?
TRUMP: En route to an uptrend?
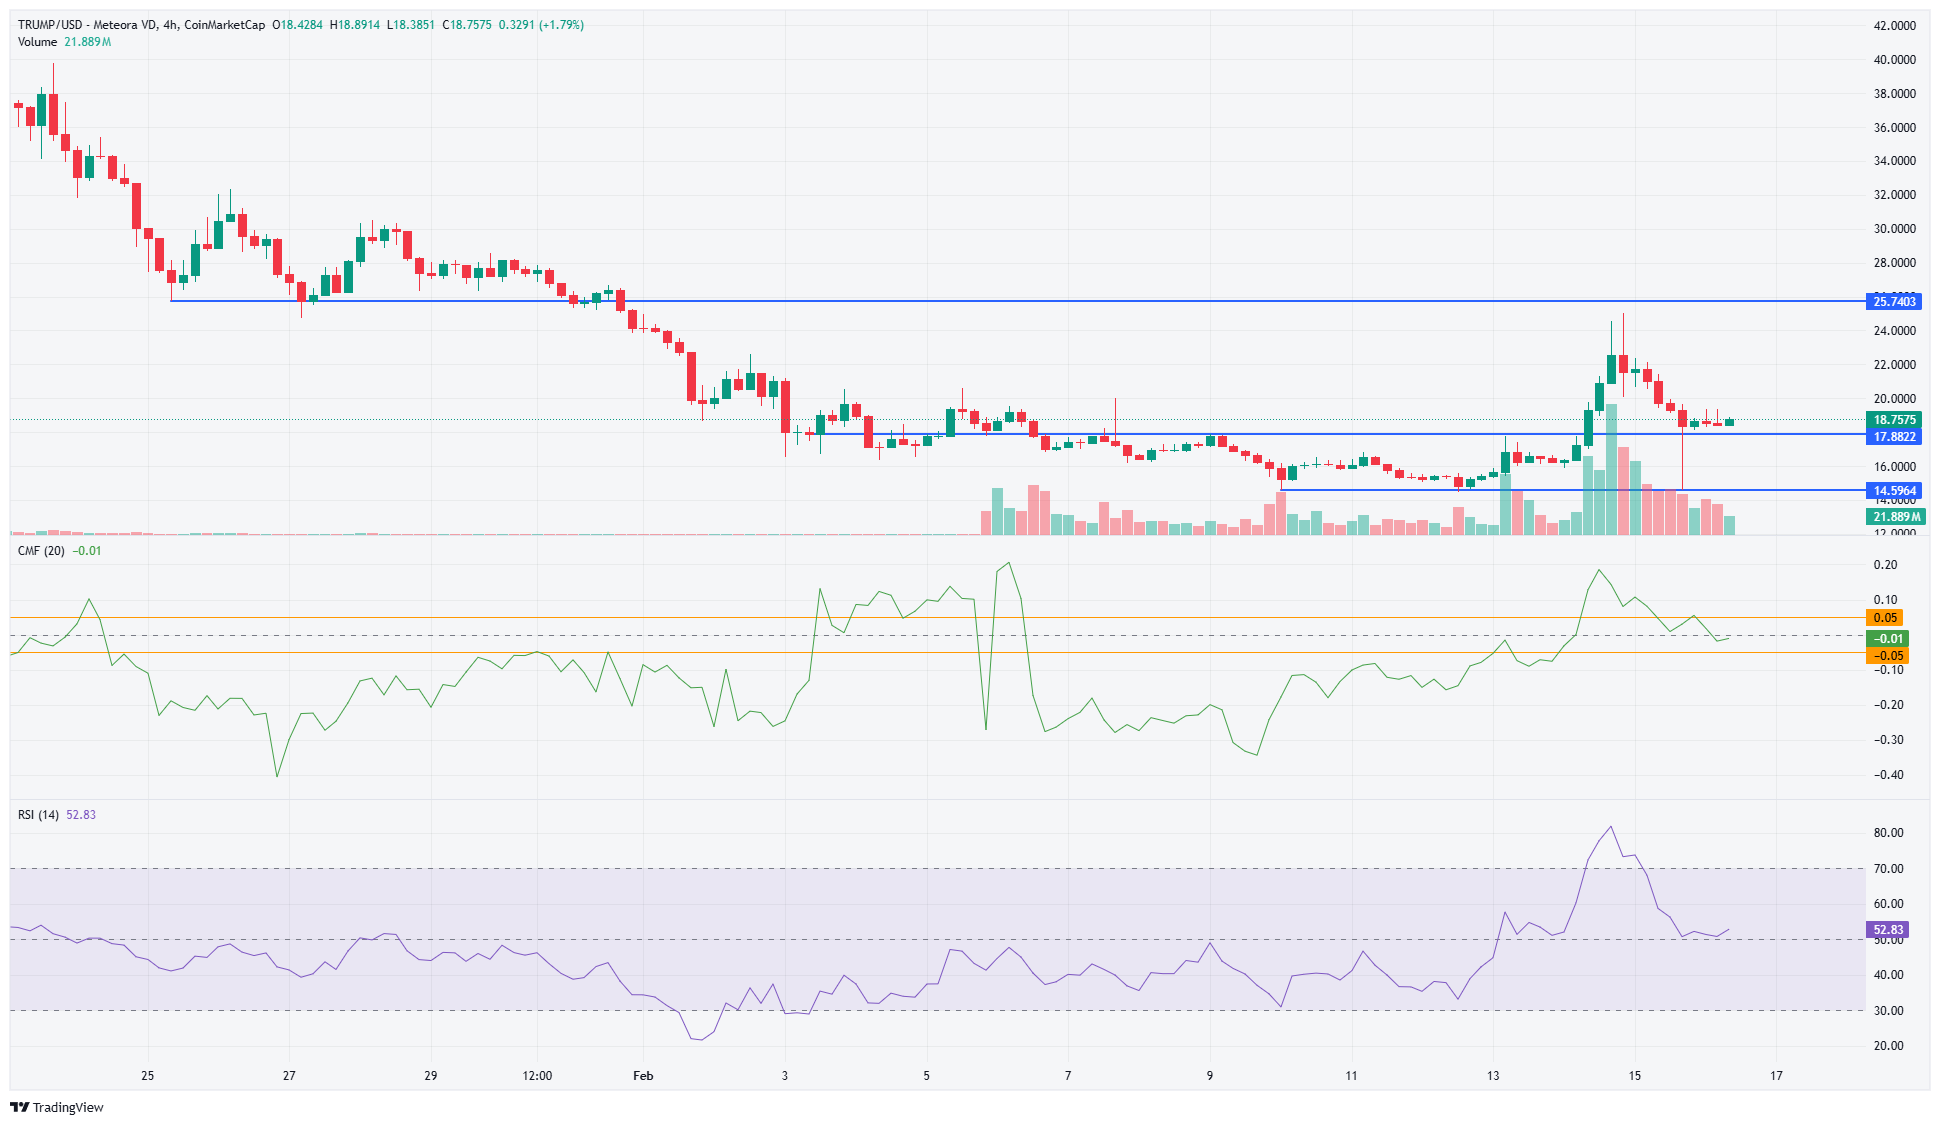

Source: TRUMP/USDT on TradingView
Official Trump had oscillated between $17.88 and $14.6 levels since the early February price drop, as mentioned earlier. These levels also marked the local high and low.
The previous downtrend had its lower high at $17.88.
When this level was breached on the 14th of February, it signaled a market structure shift.
Since then, the price appeared to make a higher low, but this would only be confirmed if TRUMP makes a higher high beyond $22.55. Its quick descent to $15 the previous day showed that bulls haven’t fully regained control.
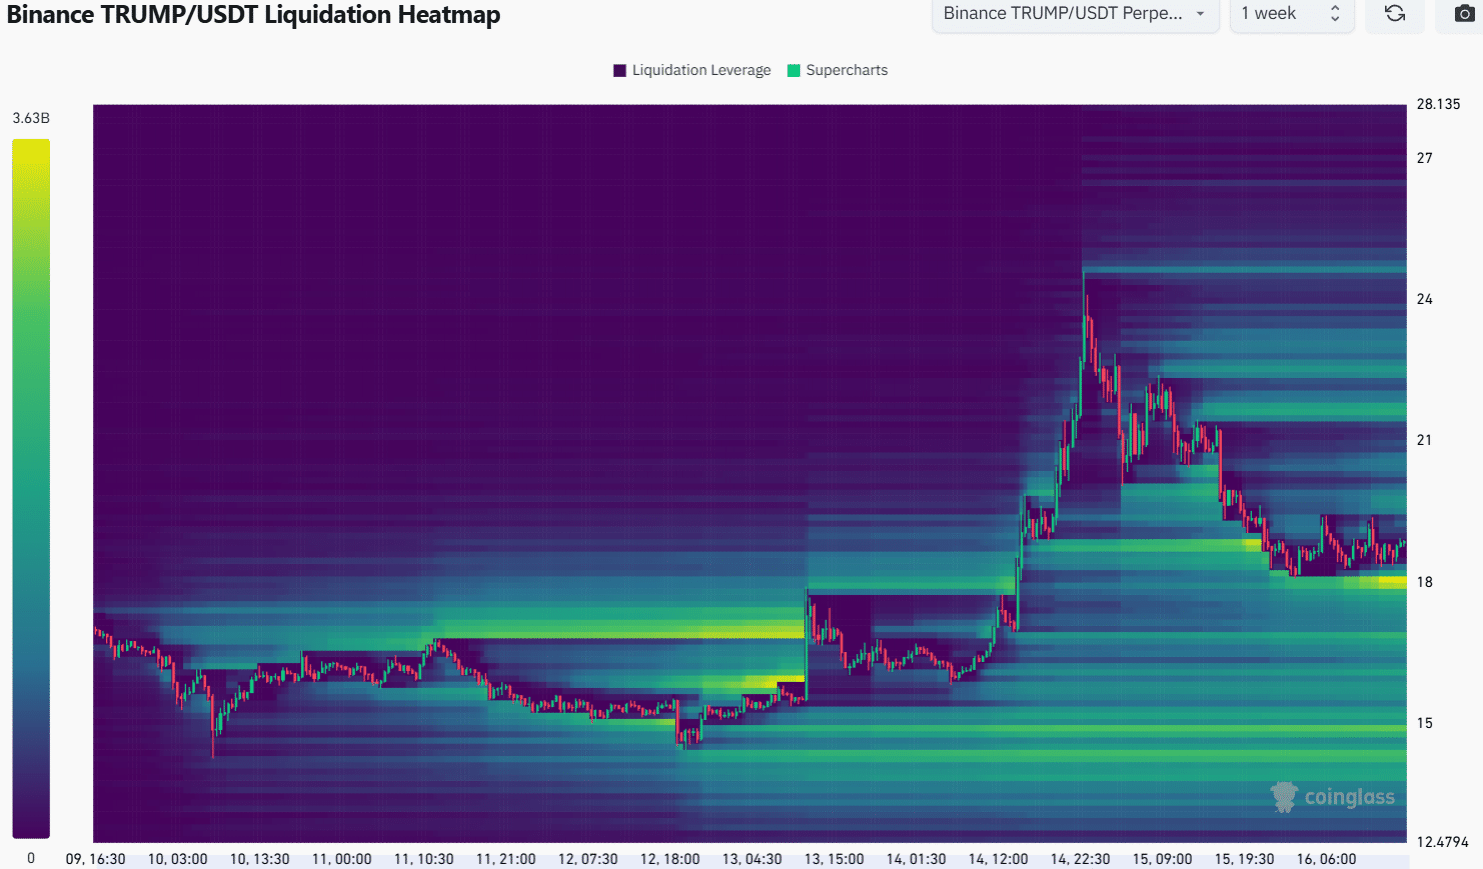

Source: Coinglass
The liquidation heatmap of the past two weeks highlighted the $18 region as a strong magnetic zone. It was also relatively close to the price, compared to liquidity clusters such as the one at $21.63.
Hence, Official Trump can retest $18 before moving higher.
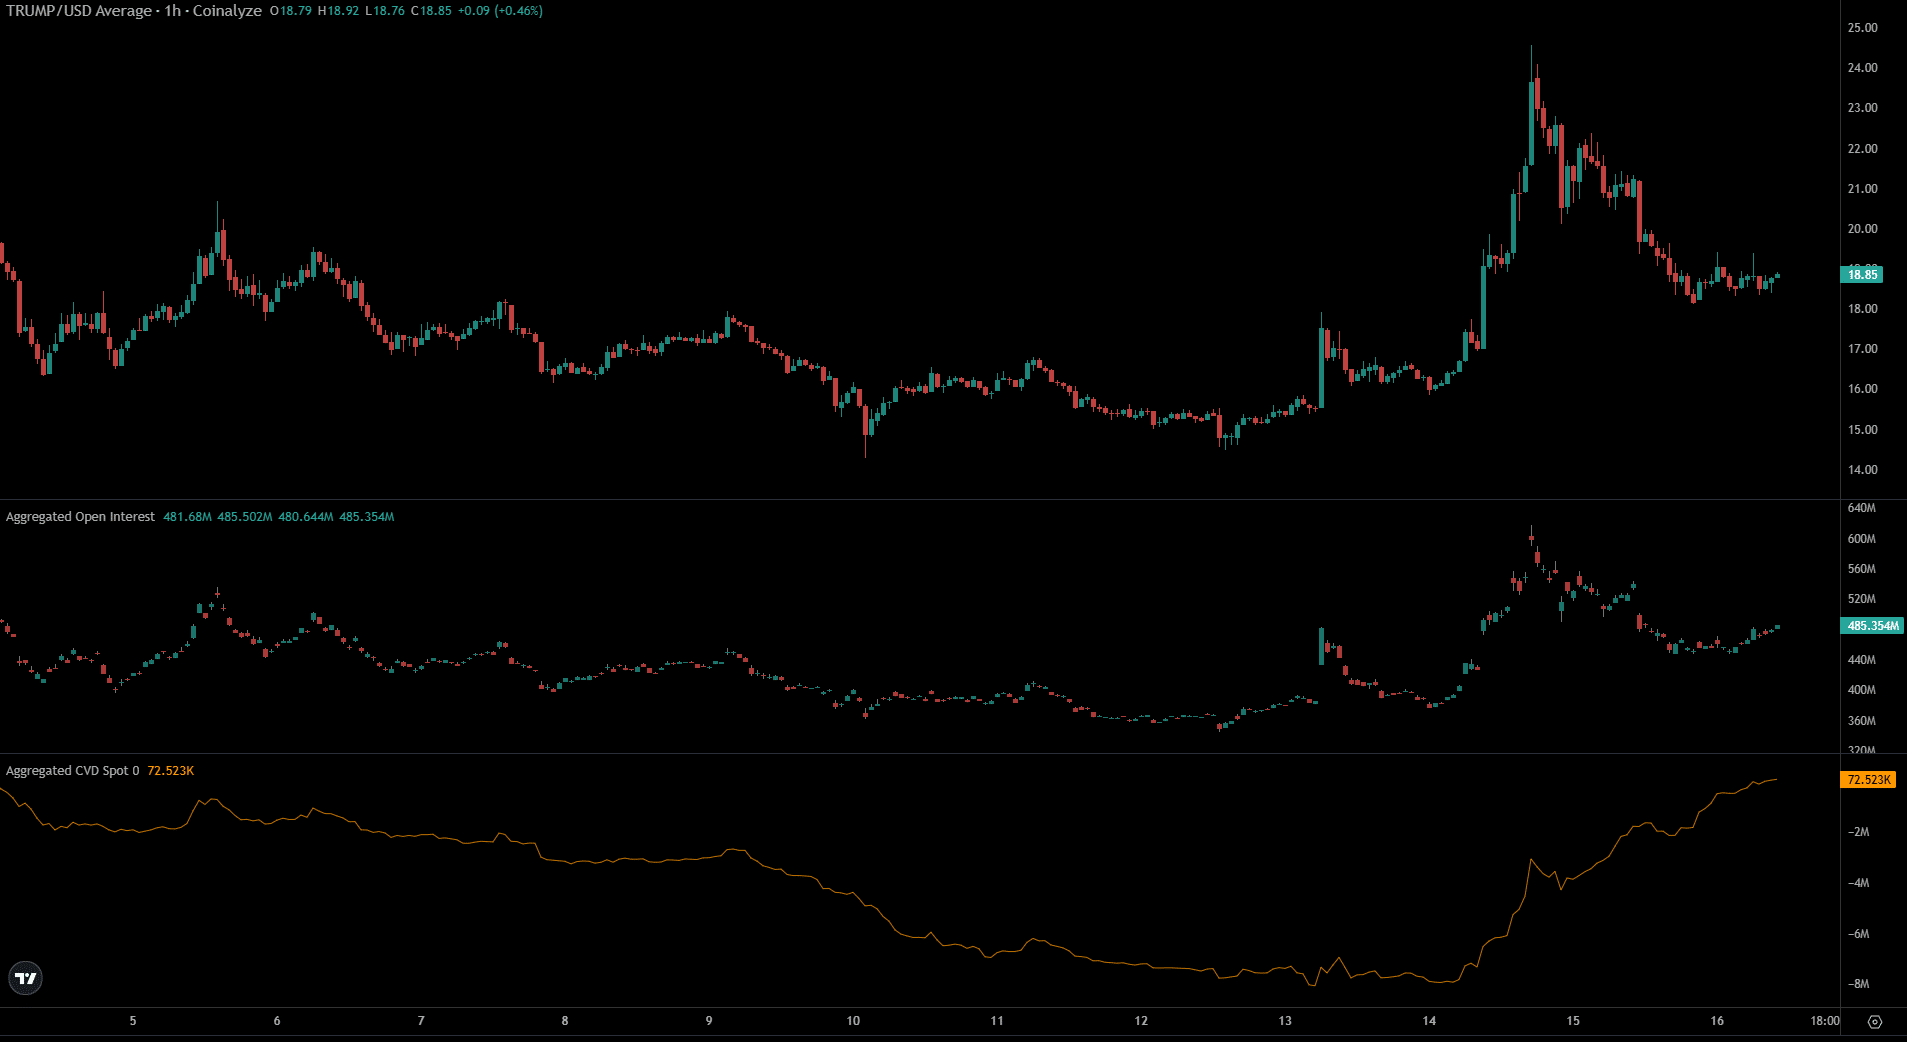

Source: Coinalyze
While the heatmap warned of a small price dip, the spot CVD and Open Interest showed bullishness was rising. The spot demand in particular has been quite strong over the past 48 hours.
If this trend continues, it could bear TRUMP beyond the $22.6 local resistance level.
Overall, the price action and the indicators showed some bullish promise in the short term.
A price move below the local support at 17.88 would invalidate this bullish idea, and continued lower highs and lower lows would signal another downtrend in play.
Disclaimer: The information presented does not constitute financial, investment, trading, or other types of advice and is solely the writer’s opinion
Source: https://ambcrypto.com/trump-flips-18-to-support-is-22-6-the-memecoins-next-stop/